SMT Divergence (Smart Money Technique)
The Smart Money Technique, commonly referred to as SMT Divergence, is a powerful analytical tool used by professional traders to identify hidden institutional footprints in the market. At its core, SMT Divergence relies on the principle of correlation between closely related financial assets. In a perfectly efficient market, highly correlated assets, such as the Euro/US Dollar (EUR/USD) and the British Pound/US Dollar (GBP/USD), should move in tandem. When one makes a new high, the other should theoretically follow suit. However, markets are rarely perfect, and it is within these imperfections that SMT Divergence reveals itself.
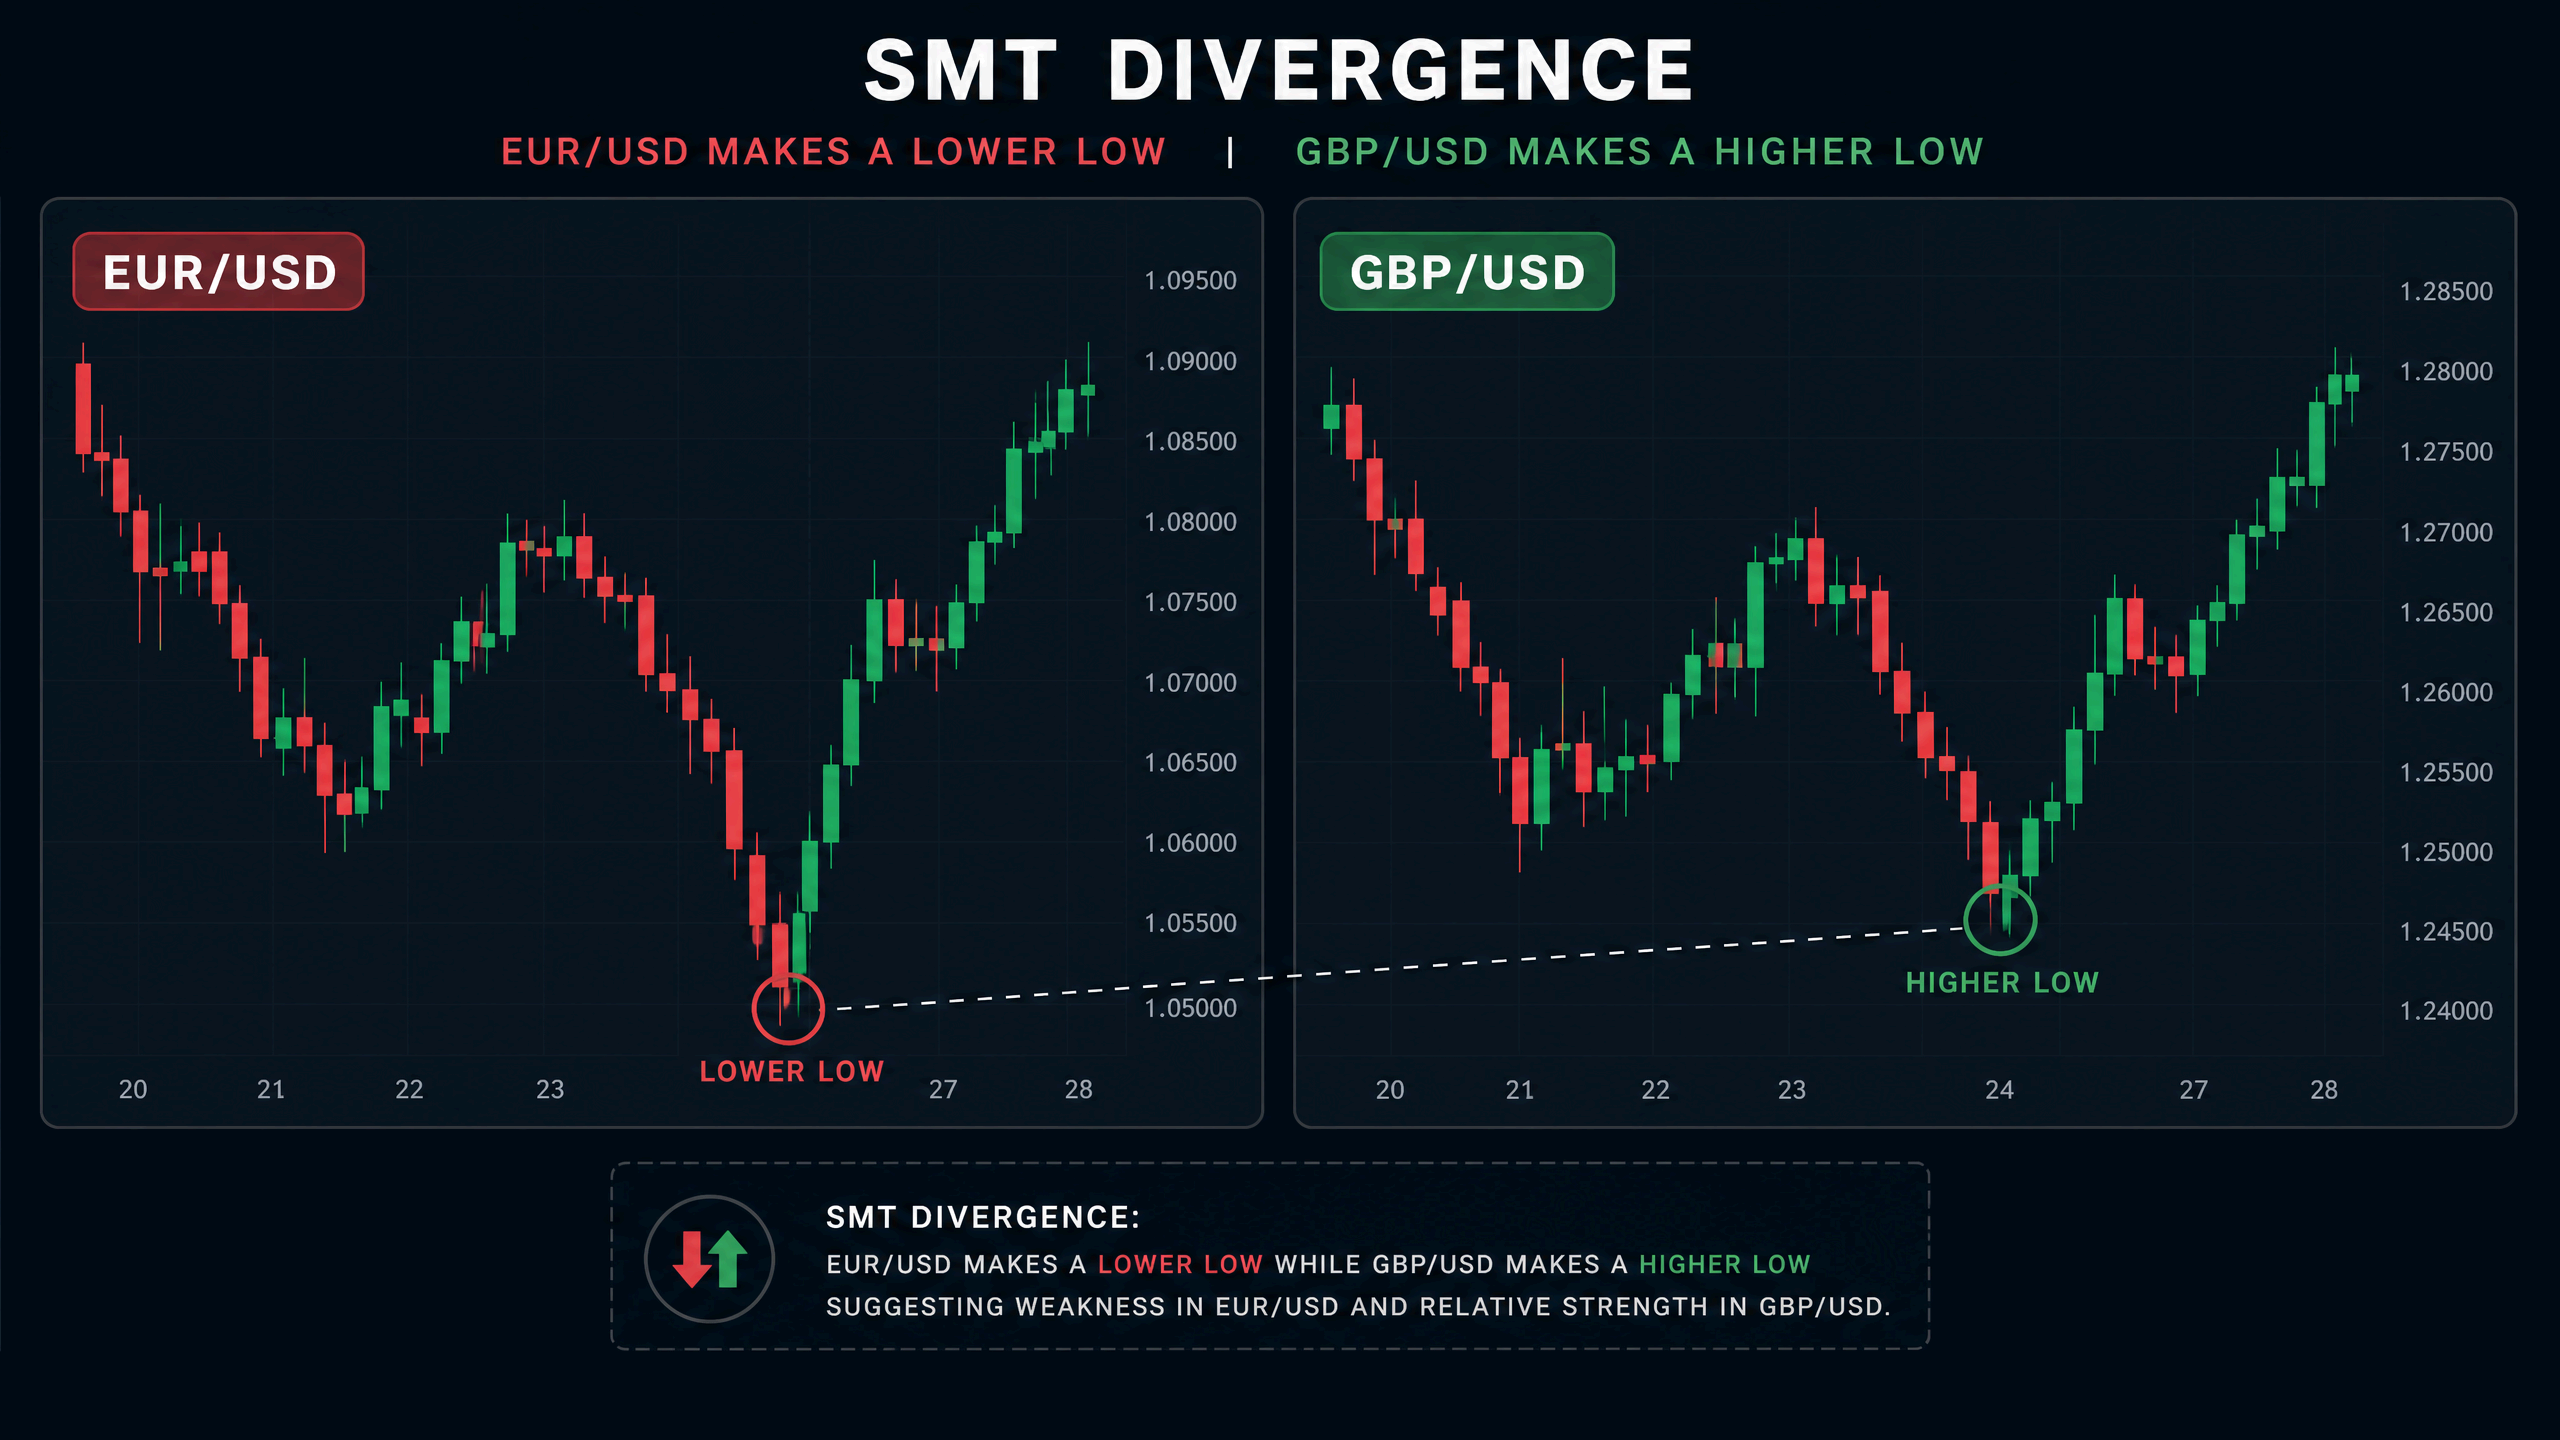
When a divergence occurs between two correlated assets, it signals a potential shift in underlying market dynamics. For instance, if the EUR/USD pushes lower to create a new lower low, but the GBP/USD fails to do the same and instead forms a higher low, a bullish SMT Divergence has occurred. This discrepancy suggests that institutional buying pressure is supporting the GBP/USD, preventing it from falling further. This hidden strength is a strong indicator that a broader market reversal may be imminent.
Conversely, a bearish SMT Divergence happens when both assets are trending upward, but one fails to confirm a new higher high. If the S&P 500 (ES) makes a new high, but the Nasdaq 100 (NQ) forms a lower high, it indicates underlying weakness in the tech sector. This failure to confirm the high suggests that smart money is beginning to distribute their positions, anticipating a downward reversal. Traders use this information to position themselves ahead of the impending move.
The true power of SMT Divergence lies in its ability to act as a leading indicator rather than a lagging one. While traditional indicators like the RSI or MACD rely on past price data, SMT Divergence looks at real-time structural failures across correlated markets. This provides traders with a unique vantage point, allowing them to anticipate reversals before they are fully apparent on a single chart.
To effectively trade SMT Divergence, it is crucial to understand the difference between positive and negative correlation. Positively correlated assets, like the ES and NQ, move in the same direction. Negatively correlated assets, such as the US Dollar Index (DXY) and the EUR/USD, move inversely. A bullish signal in a negatively correlated pair would involve the DXY making a higher high while the EUR/USD fails to make a lower low.
Timing is also a critical factor when utilizing SMT Divergence. This technique is most effective when it occurs at key higher timeframe levels of support or resistance, often referred to as PD Arrays. When an SMT Divergence forms at a daily order block or a significant fair value gap, the probability of a successful reversal increases dramatically.
Furthermore, SMT Divergence is frequently observed during specific times of the day, known as “kill zones.” The London open and the New York open are prime times for institutional manipulation, making them ideal windows to look for SMT signals. During these periods of high volatility, smart money often engineers false moves to trap retail traders, and SMT Divergence can help identify these traps.
While SMT Divergence is a robust concept, it is not infallible. One common mistake traders make is relying solely on the divergence without considering the broader market context. SMT should always be used in conjunction with market structure analysis and an understanding of the overall trend. A divergence against a strong macroeconomic trend is less likely to succeed than one that aligns with it.
Another pitfall is attempting to force an SMT Divergence where none exists. Traders must be patient and wait for clear, unambiguous structural failures between correlated assets. Forcing a trade based on a slight or questionable divergence often leads to unnecessary losses.
In conclusion, SMT Divergence is a sophisticated technique that requires practice and a deep understanding of market correlations. By identifying these subtle discrepancies, traders can align themselves with institutional order flow and improve their ability to catch significant market reversals.
• Acts as a leading indicator for market reversals.
• Provides insight into institutional order flow and hidden strength/weakness.
• Highly effective when combined with higher timeframe key levels.
• Requires monitoring multiple charts simultaneously.
• Can produce false signals if used against strong macroeconomic trends.
• Takes time and practice to identify accurately in real-time.